
A MORE CONSIDERED ADVANTAGE
Old Lyme, CT
Market Report
Current market conditions, pricing, inventory and transaction velocity for Old Lyme.
Updated October 23, 2026
Old Lyme
Old Lyme remains seller-favorable, with relatively limited inventory compared with recent sales activity.
Sale to List Ratio98.2%
Months of Inventory3.0
Median Days on Market4
Closed Sales — 30 Days11
Rolling 30-Day Median Sale Price
$858,500
Nov
Dec
Jan
Feb
Mar
Apr
May
Jun
Jul
Aug
Sep
Oct
Rolling 30-day median sale price, sampled weekly over the last 12 months.
98.2%
Compares closed sale price with original list price for the trailing 30-day period.
Seller Favorable
Seller Favorable< 4 mo
Balanced4–6 mo
Buyer Favorable> 6 mo
Months of inventory compares available homes with the recent pace of closed sales. Lower supply favors sellers; higher supply gives buyers more leverage.
Single Family
28
85%
Lots and Land
4
12%
Condo/Co-Op
1
3%
Active Inventory
• 0.0%
Coming Soon
• 0.0%
Pending Sales
• 0.0%
Closed Sales
▲ 22.2%
Median Sale Price
▼ 11.3%
Median DOM
▼ 75.0%
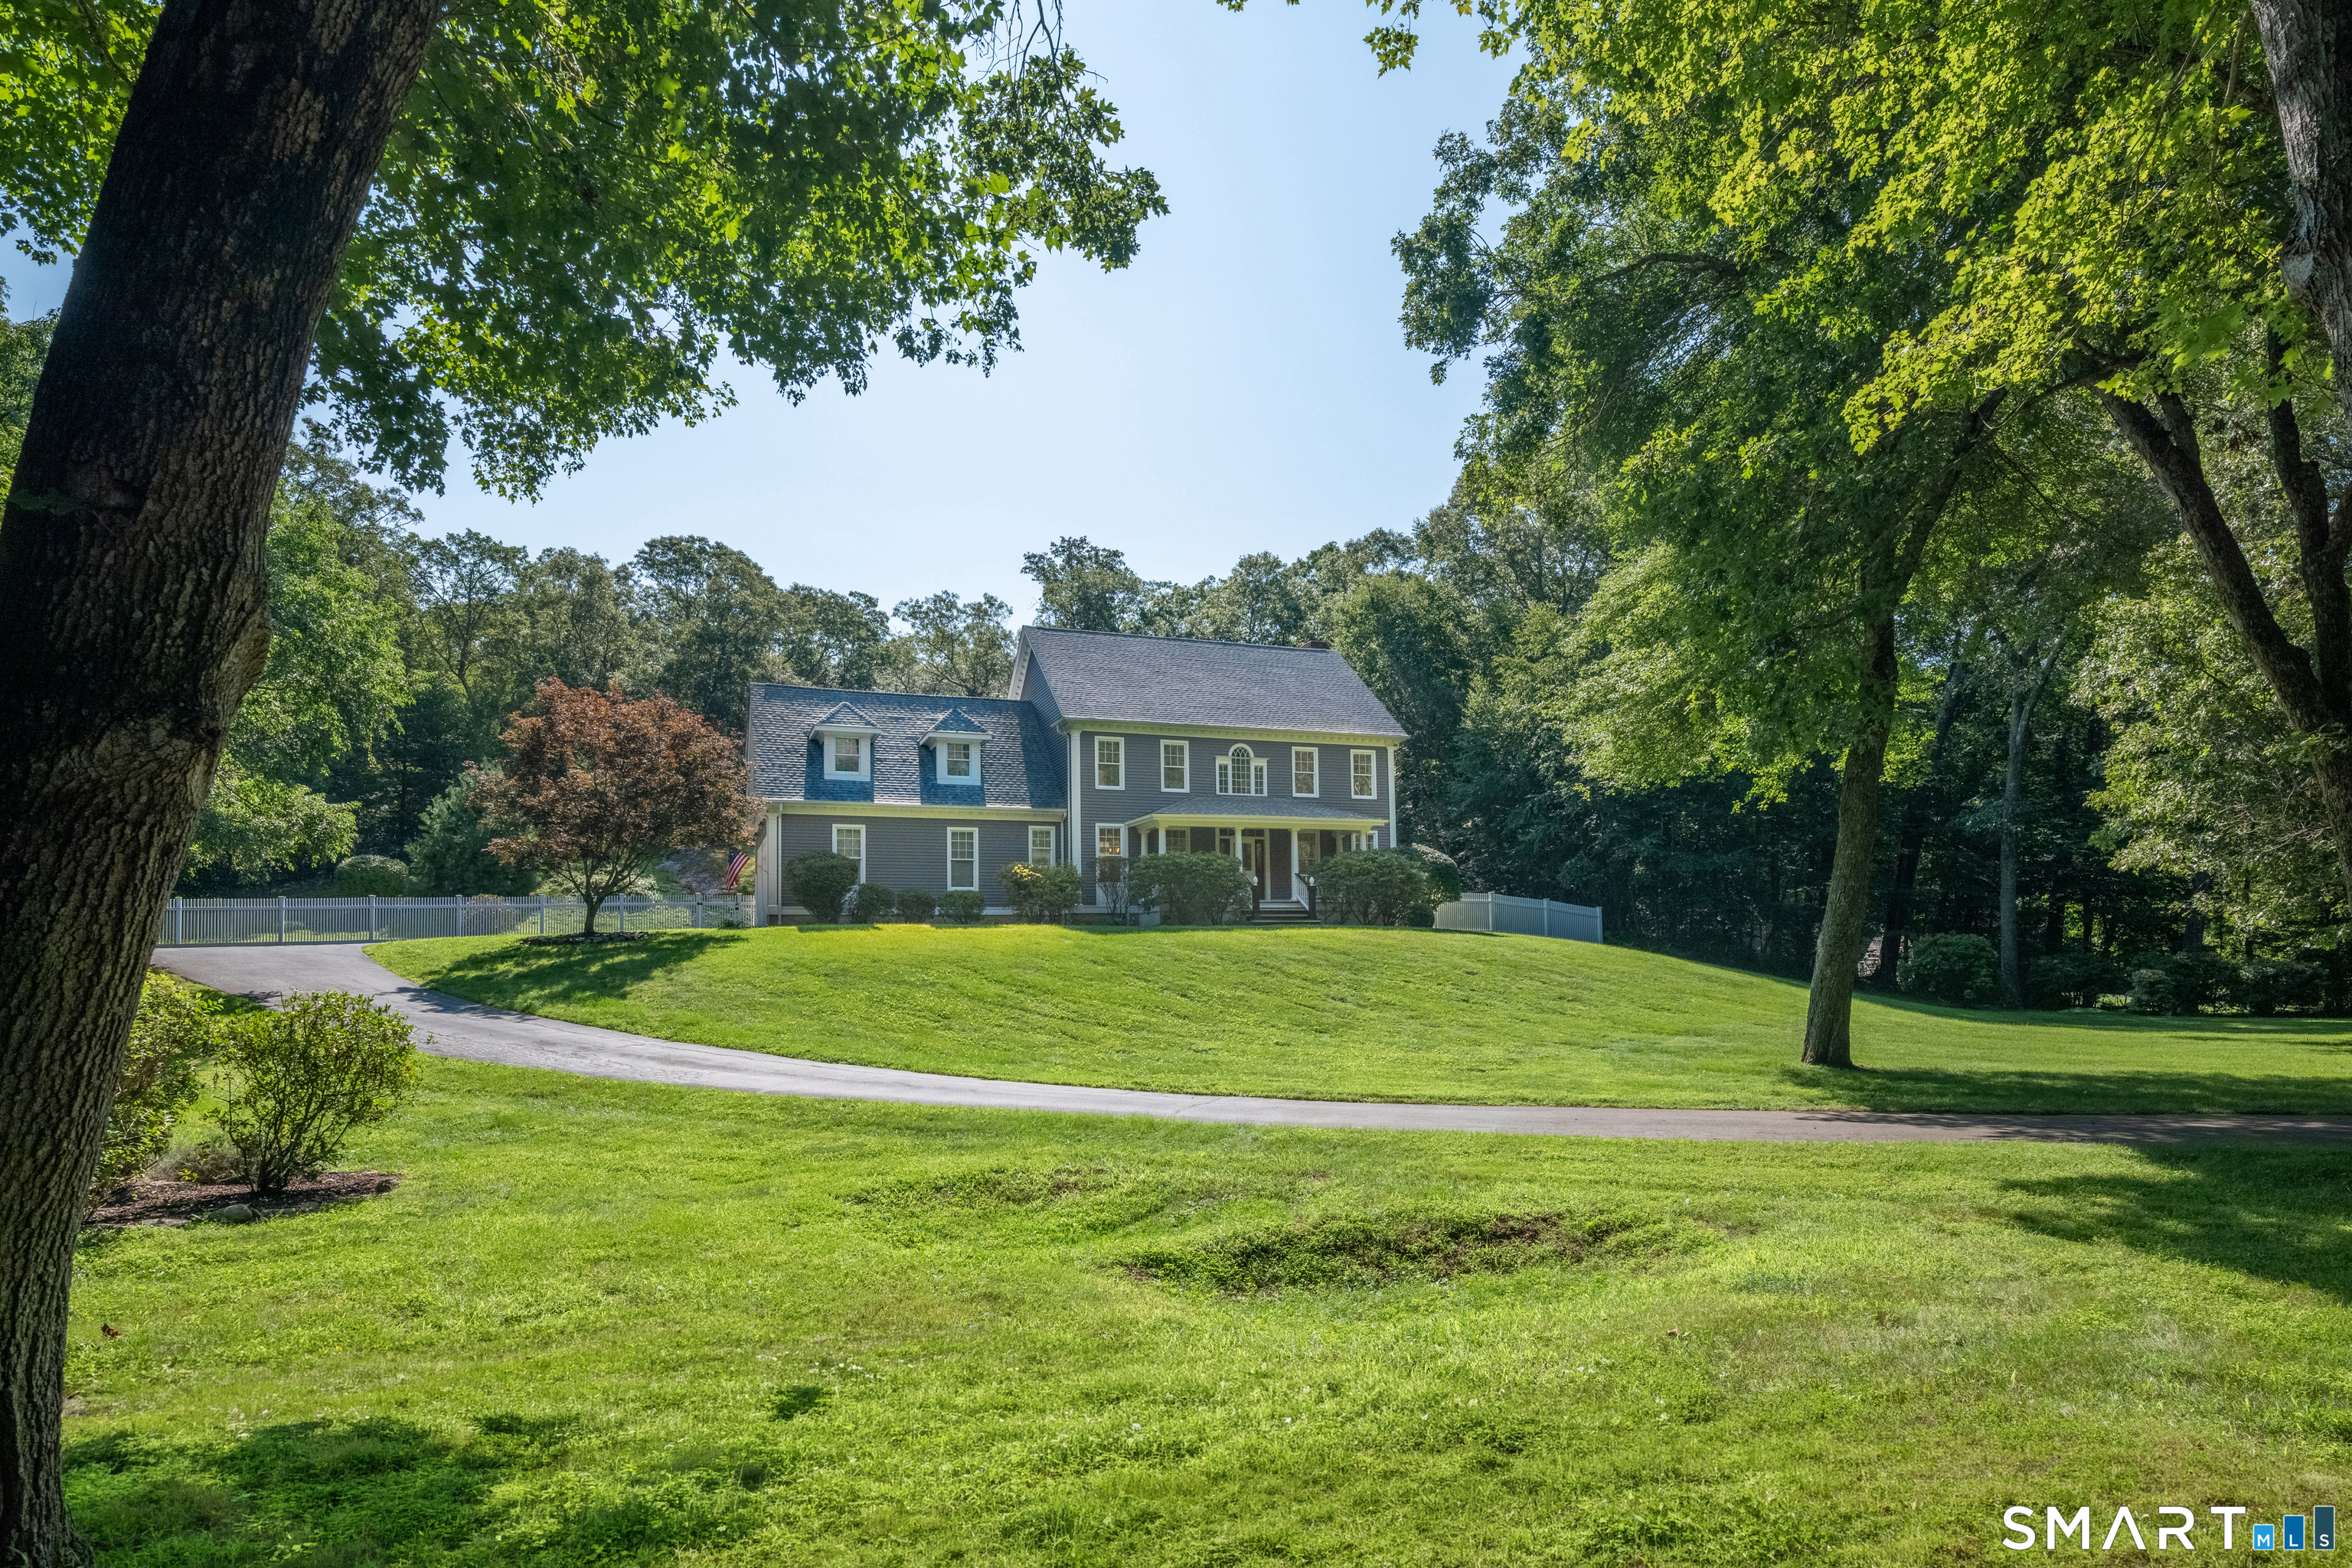
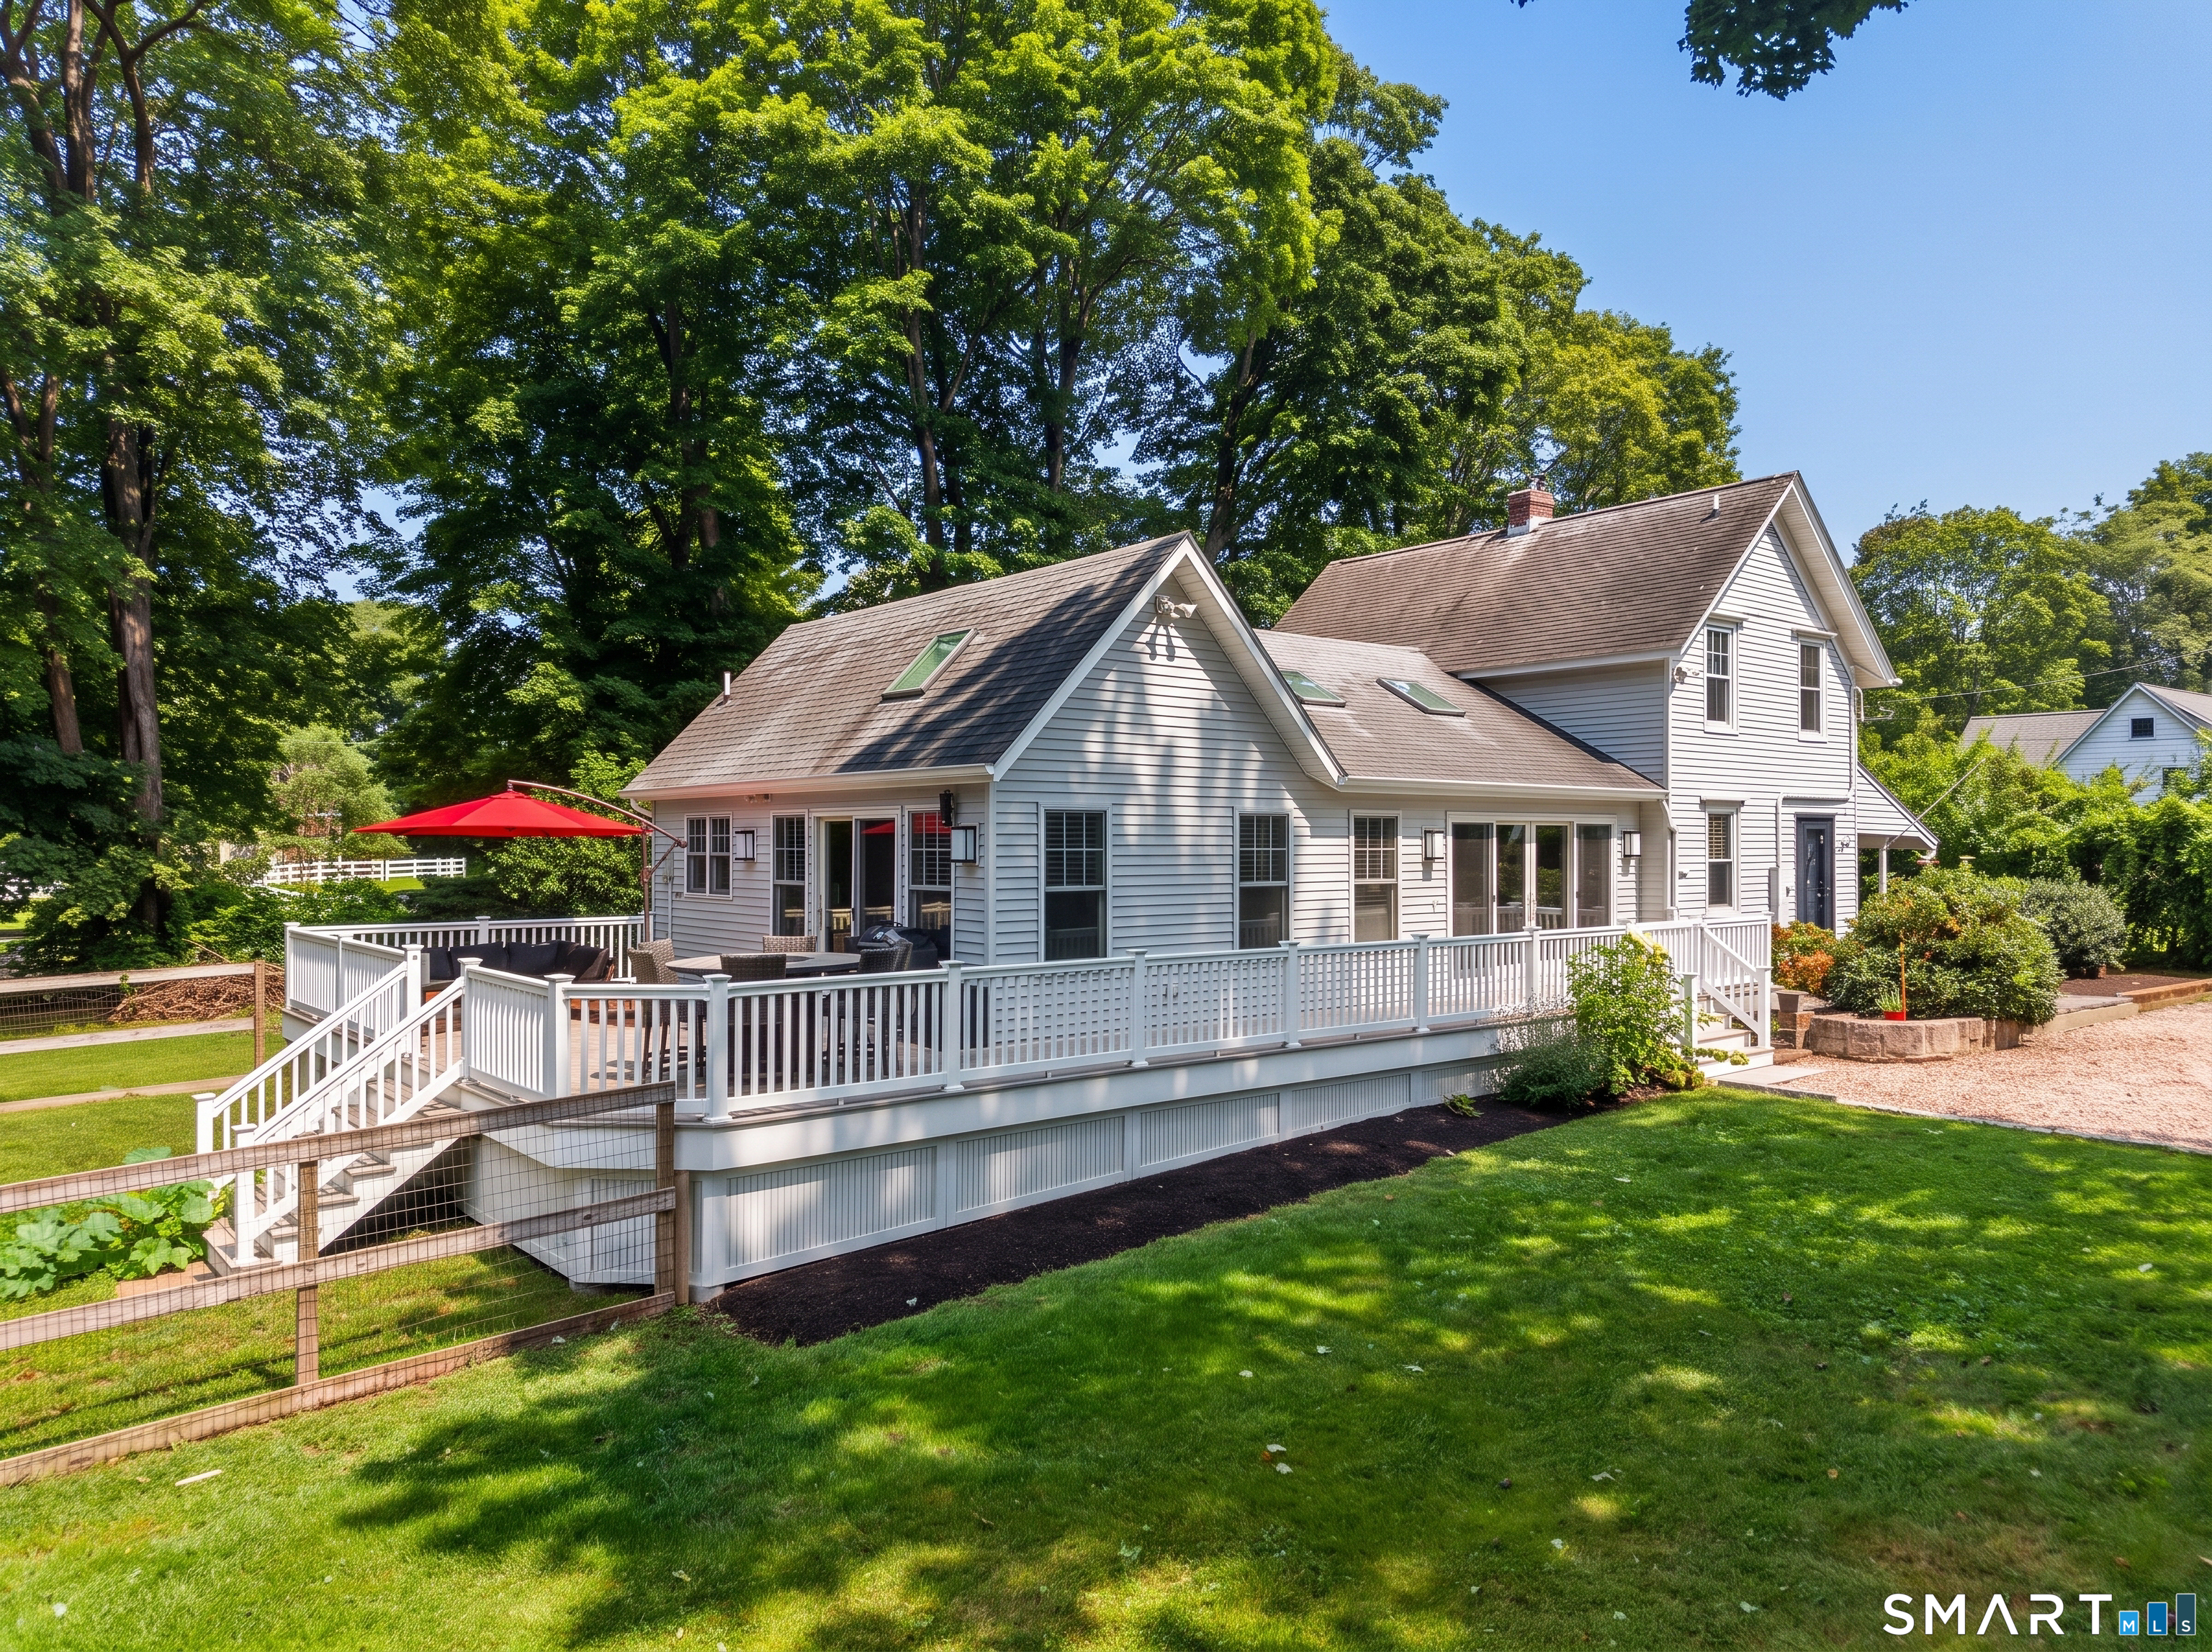
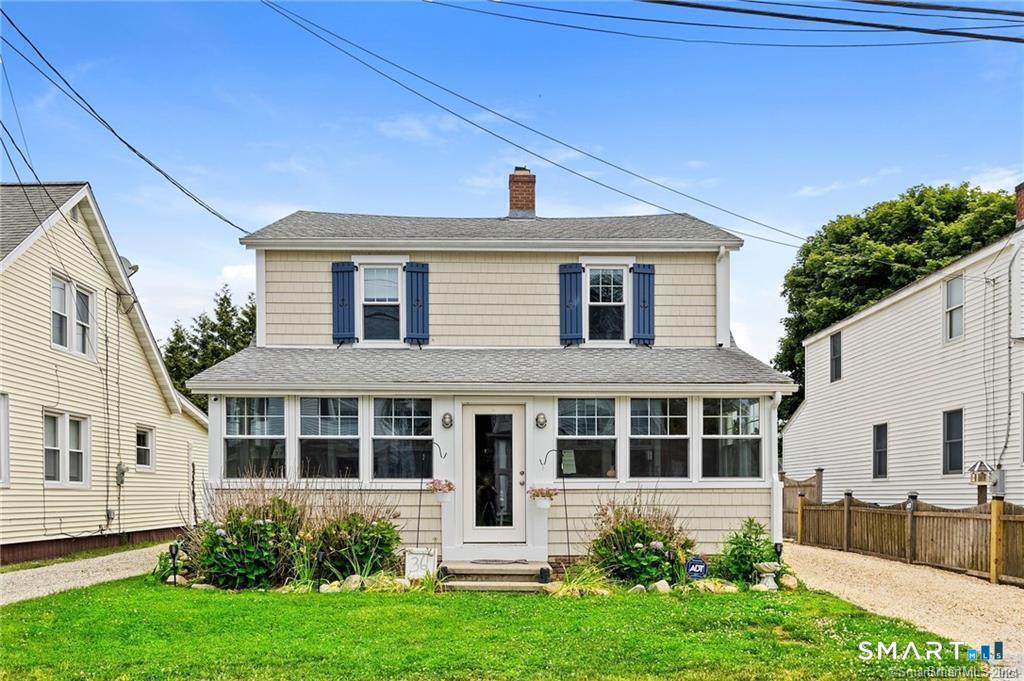
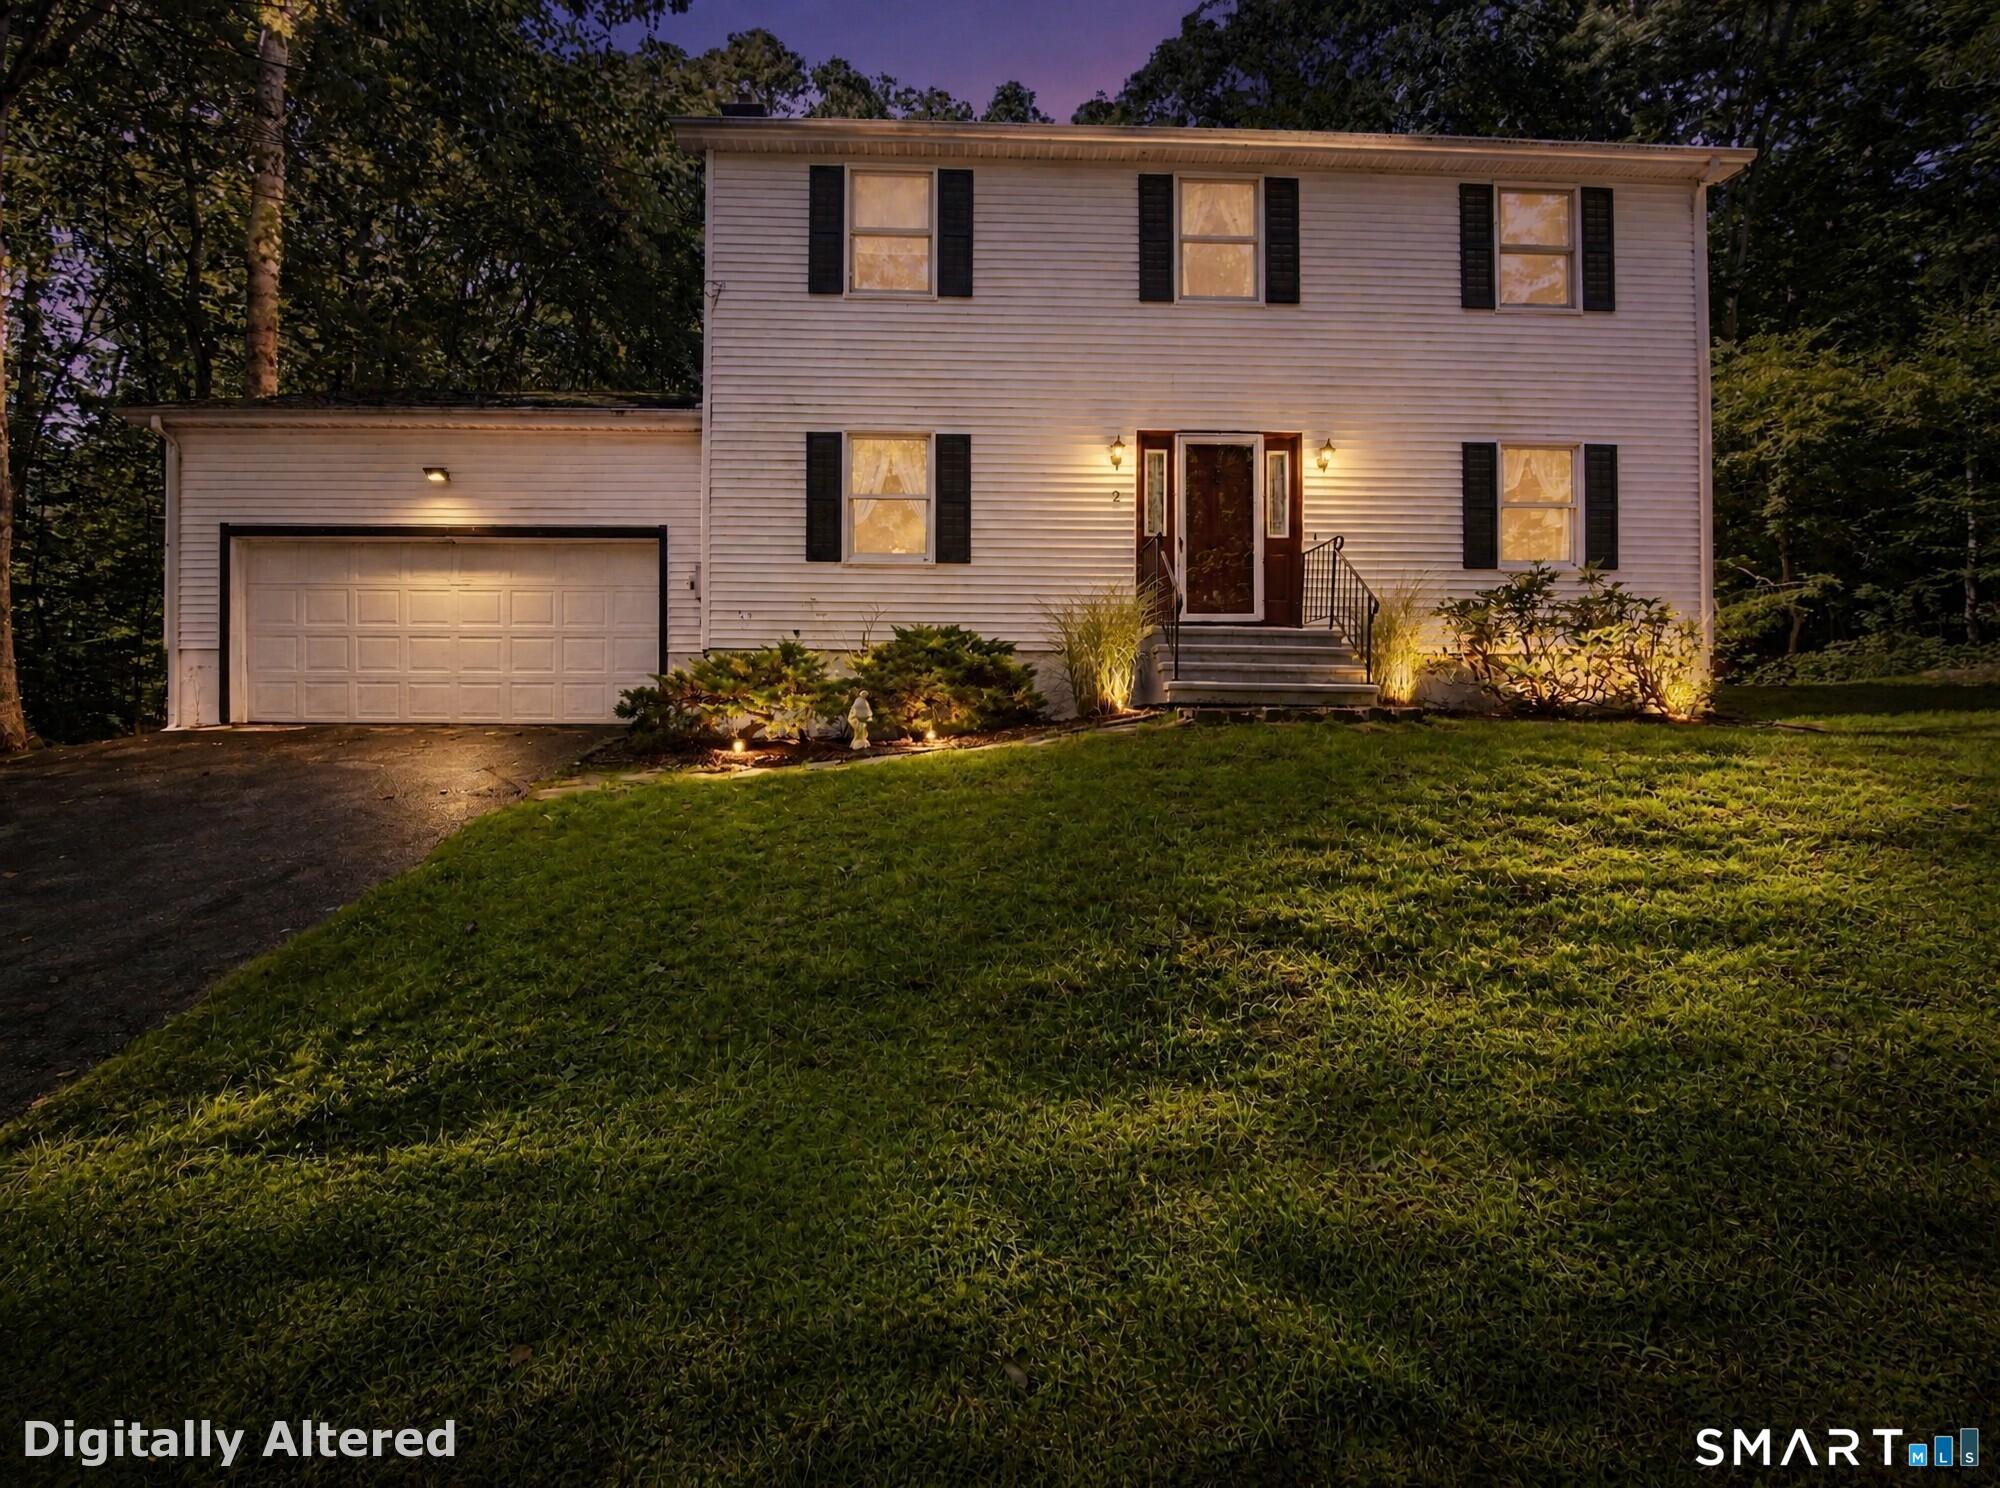
Selected Properties
View All Properties →
Old Lyme


Local Market Intelligence
Know Old Lyme.